


| Search | |
|---|---|
5 - Pooled prevalence for fixed pool size and tests with known sensitivity and specificity
These methods use frequentist approaches to estimate prevalence and confidence limits, assuming a fixed pool size and a test with known values for sensitivity and specificity, as described below.
Method 3
This method (Method 4 from Cowling et al. (1999) assumes a fixed pool size and that test sensitivity and specificity are known exactly (no uncertainty about their values). Confidence limits are based on a normal approximation and may be <0 for low prevalence values.
Prevalence is estimated as: 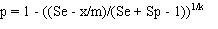
and the standard error (SE(p)) is estimated as the square root of the variance, given by: 
where:
- p = estimated prevalence;
- k = pool size;
- m = the number of pools tested;
- x = the number of positive pools;
- Se = the sensitivity of the test; and
- Sp = the specificity of the test;
Asymptotic confidence limits are calculated using the normal approximation:
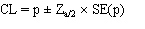
where  is the standardised normal variate corresponding to the desired confidence limit.
Required inputs for this method are:
- pool size;
- number of pools tested;
- number of pools positive;
- assumed sensitivity of the test;
- assumed specificity of the test; and
- desired upper and lower confidence limits for the estimate.
Pool size, number of pools and number of pools positive must be positive integers and the number of positive pools must be less than the number of pools tested. Sensitivity and specificity must be >0 and <=1 and upper and lower confidence limits must be >0 and <1.
Outputs include:
- a point estimate of animal-level prevalence;
- upper and lower asymptotic confidence limits;
- the standard error for the estimate; and
- graphic and text files of estimates and confidence limits for all possible results (download by clicking on the appropriate icon).
Estimates are only valid if the proportion of positive pools is greater than the false positive rate (1 - Specificity) and less than or equal to the true positive rate (Sensitivity). Invalid results are indicated by NA in the results table.
Method 4
This method (Method 5 from Cowling et al. (1999)) assumes a fixed pool size and that test sensitivity and specificity are known exactly (no uncertainty about their values). Exact confidence limits are calculated based on binomial theory, so that confidence limits are never <0 or >1.
Prevalence and variance are estimated as for Method 3:
and:
where:
- p = estimated prevalence;
- k = pool size;
- m = the number of pools tested;
- x = the number of positive pools;
- Se = the sensitivity of the test; and
- Sp = the specificity of the test.
Exact confidence limits are estimated by calculating the corresponding binomial confidence limits for the proportion of positive pools and then transforming these back to individual-level prevalence values using the equation for estimating prevalence from Method 3.
Required inputs for this method are:
- pool size;
- number of pools tested;
- number of pools positive;
- assumed sensitivity of the test.
- assumed specificity of the test; and
- desired upper and lower confidence limits for the estimate.
Pool size, number of pools and number of pools positive must be positive integers and the number of positive pools must be less than the number of pools tested. Sensitivity and specificity must be >0 and <=1 and upper and lower confidence limits must be >0 and <1.
Outputs include:
- a point estimate of animal-level prevalence;
- upper and lower exact (binomial) confidence limits;
- the standard error for the estimate; and
- graphic and text files of estimates and confidence limits for all possible results (download by clicking on the appropriate icon).
Estimates are only valid if the proportion of positive pools is greater than the false positive rate (1 - Specificity) and less than or equal to the true positive rate (Sensitivity). Invalid results are indicated by NA in the results table.
« Previous Next »